By Bryan McCormick (Original Post HERE)
Gold and its popular proxy, the SPDR Gold Shares exchange-traded fund (GLD), have resumed their bullish uptrend after Tuesday's selloff. For now.
In the last several weeks, gold enjoyed a resurgence on the back of the second phase of the PIIGs crisis. World Bank President Robert Zoellick further stoked the flames of gold prices last week by suggesting that the metal had a role to play in modern monetary policy. But the higher dollar level sparked by weakness in the euro has definitely been a factor in lower prices for gold recently.
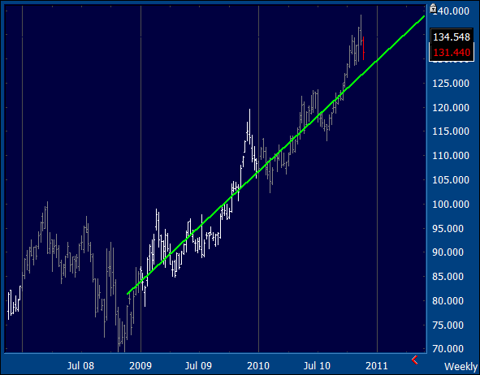
On the weekly chart below, which is an update to one I produced months ago, the SPDR Gold Trust is still in bullish mode. The linear regression line I drew and then projected forward is still valid as an indicator of trend. What is happening, however, is that the GLD is being drawn back to that line.
(Click to enlarge)
As we can see on the chart, this has happened several times in the last two years. Price tends to "twist" around the regression line on either side of it. Given the strength of the move, it would take a very large downside drop to break the trend. Nonetheless, migrations back to that line are not going to fell bullish as the swing in price is quite wide.
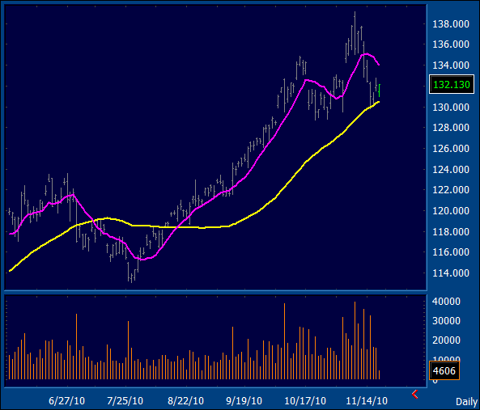
In a shorter time-frame, the picture is a bit different. As my editor Mike Yamamoto pointed out, the daily chart looks bearish.
(Click to enlarge)
The potential pattern he spotted looked like a developing bearish "head and shoulders" top. I am showing the chart above with a 10-day moving average in pink and a 50-day moving average in yellow.
The 10-day moving average does look like a left shoulder and head of a bearish head and shoulders. It could also be a bearish "cup and handle" (or, in this case, a "handle and cup"). If the GLD breaks below the trigger point at the $128 area soon, then the right shoulder of the head and shoulders would never form.
That trigger point is the same for both patterns, as they are really part of one another. The cup and handle would have the same downside, to about $119. On the long-term weekly chart, that objective would call the long-term term trend itself into question. It would, if it were to happen, mark the biggest gap away from trend on the downside in many years.
There is an important mitigating factor though on the daily chart. The 50-day moving average appears to be holding as support. It was last at the $130.50 area. As long as that line holds and is still acting as an uptrend line, then the patterns in question won't develop.
In that case this would be a test down to support, with a strong possibility of more upside to come. As we have seen in the past, when patterns fail they can have a counterreaction as strong as the expected reaction.
Disclosure: No position (OptionMonster)


No comments:
Post a Comment