CO2 EMISSIONS FROM FUEL COMBUSTION
I E A S T A T I S T I C S
International Energy Agency
List of countries by carbon dioxide emissions
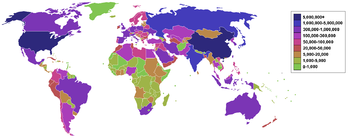
This is a list of sovereign states and territories by carbon dioxide emissions due to human activity. The data presented below corresponds to emissions in 2008. The data was collected by the CDIAC for the United Nations. The data only considers carbon dioxide emissions from the burning of fossil fuels and cement manufacture, but not emissions from land use such as deforestation. The top 10 countries in the world emit 67.07% of the world total.[1][2][3][4][5][6] Other powerful, more potent greenhouse gases are not included in this data, including methane.
Some dependencies and territories whose independence has not been generally recognized are also included as they are in the source data. Certain entities are mentioned here for purposes of comparison. These are indicated in italics and are not counted in the ordering of sovereign states. (See also: carbon cycle) On 6 October 2010, the International Energy Agency released its own data set (calculated using slightly different methods than CDIAC) for 2008 emissions that listed about 140 countries.[7]
Top Ten Countries by 2008 emissions
| Rank | Country | Annual CO2 emissions[8][9] (in thousands of metric tonnes) | Percentage of global total |
| World | 29,888,121 | 100% | |
| 1 | 7,031,916 | 23.33% | |
| 2 | 5,461,014 | 18.11% | |
| - | 4,177,817.86[11] | 14.04% | |
| 3 | 1,742,698 | 5.78% | |
| 4 | 1,708,653 | 5.67% | |
| 5 | 1,208,163 | 4.01% | |
| 6 | 786,660 | 2.61% | |
| 7 | 544,091 | 1.80% | |
| 8 | 538,404 | 1.79% | |
| 9 | 522,856 | 1.73% | |
| 10 | 509,170 | 1.69% | |

China CO2 emission in millions of metric tons from 1980 to 2009.


No comments:
Post a Comment